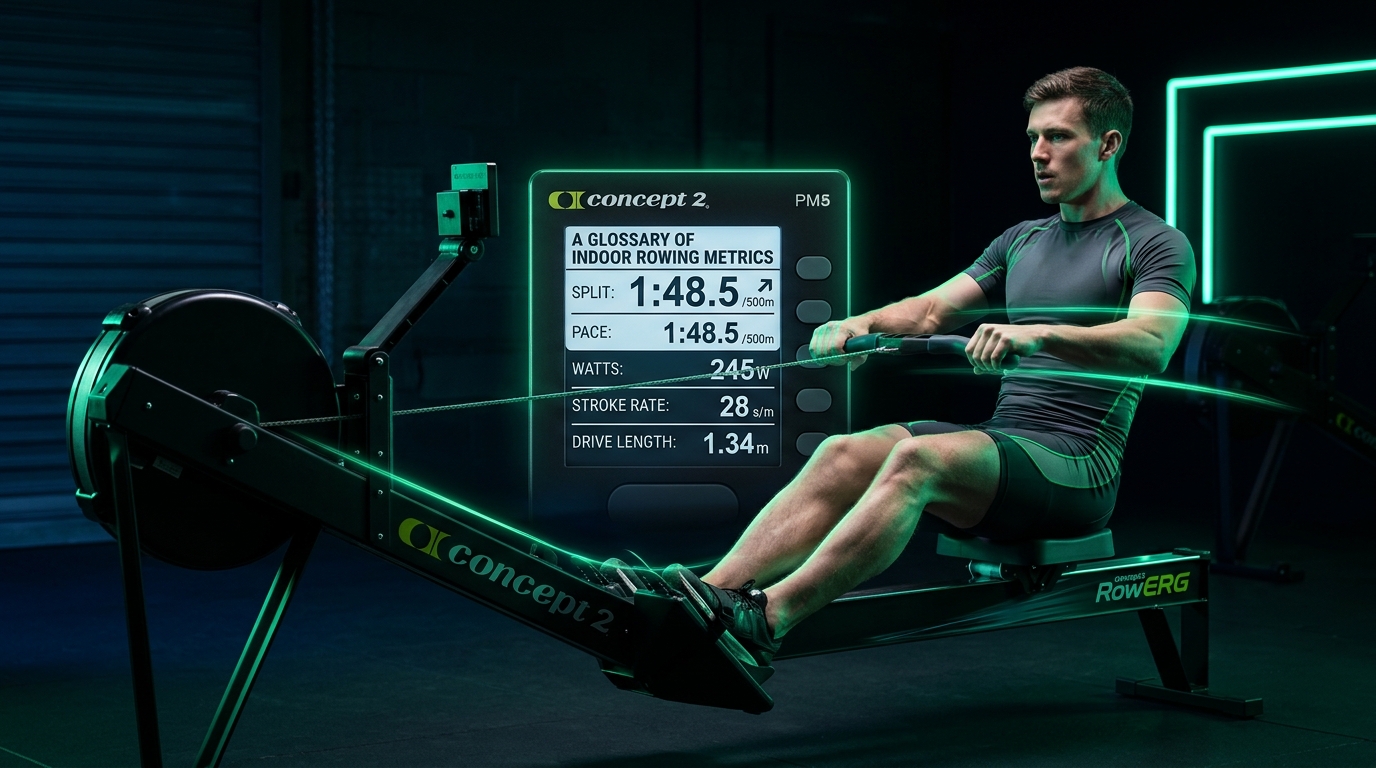
The monitor beeps and the screen fills with numbers, and you cannot tell which one to care about. Time. Distance. A figure that looks like a clock but is not. Stroke rate. Watts. Calories. Heart rate. You finish the piece, log the row, and never find out what any of it meant. That is a waste, because the screen is not a list of scores. It is a set of answers to three questions — how much did I do, how hard did I do it, and how did it go — and once you sort the readings into those piles, the numbers start telling you something you can act on.
The context
Every erg monitor is a wall of numbers, and the numbers arrive before the explanation does. You set the machine up, press a button, and the display starts reporting a clock, a distance, a rate, a power figure, a calorie count. Within a minute you are making decisions with quantities nobody taught you.
The display is not neutral either. The manufacturer's own guide describes five screens, one showing current pace, time, distance, average pace and stroke rate at once, and a units button that moves you between time per 500 m, watts and calories while you row ([2] Concept2 2024).
Almost none of these numbers is a measurement of you. They are calculations the machine makes from what it can see: a fan, a handle and a clock. It cannot see your body and it does not know your mass. That does not make the monitor useless. It makes it an instrument, and an instrument is only useful once you know what it measures.
The core idea
Sort the screen into three piles and the fog lifts.
How much did I do? The clock and the split: the size of the job you turned up for, and the pace you covered it at.
How hard did I do it? Stroke rate and watts: the effort itself, and the pair most often confused with each other.
How did it go? Distance, calories and heart rate: where you got to, what the machine thinks it cost, and what your cardiovascular system was doing.
Everything else on the screen is a variation or a refinement of one of those three: average pace is a refined split, peak watts is a refined watt figure.
The how-to
Time
The clock is the least interesting number on the screen and the most necessary one. It says nothing about how you rowed: a twenty-minute piece can be a warm-up or a race. Its job is to be the ruler the other readings are measured against — the average split is the total time cut into 500 m pieces, the calorie rate is per minute, watts are work per second.
Distance
The metres on the monitor are not a distance through water. There is no water and no course; the machine converts the work you did into a number that behaves like distance so that you can compare with the water. The manufacturer's own description of an ergometer is a machine that measures work, and the monitor works out how much work each stroke produced ([2] Concept2 2024). That is why the reading is a fair unit for comparison and a poor unit for geography: two thousand metres on an erg is not two thousand metres of water.
Distance belongs in the third pile because it is an outcome. It tells you how far your effort carried you in the time you had.
Split
This is the number rowers actually learn to read.
A split is the time to cover 500 m, written as minutes and seconds, so 2:00 means two minutes per 500 m. The convention comes from the water: on-water rowers talk in time per 500 m because the Olympic race is 2000 m and crews break it down into four 500 m segments. The same measure was carried indoors, and it became what most erg rowers use ([1] Concept2 2015).
Two things catch people out. First, a lower split means more work, not less. The smaller the number, the less time you take for the same distance, which means more water per second, which means more power. A piece at 1:45 is harder than a piece at 2:05.
Second, there are two split numbers answering different questions. The large figure on the screen is the split for the 500 m you are currently rowing, and it resets each time you cross 500 m. The other is the average for the whole piece: total time divided by total distance. The average compares with other people, because it is the only one that describes the whole piece. Say you settle at 2:00 for the first 1000 m and drift to 2:10 over the second: your average is 2:05 and your live figure says 2:10 — two numbers telling you different things.
Stroke rate
Stroke rate is the number of strokes per minute, shown as s/m. It counts. The monitor can see the handle move and knows how many times you drove it, and has no idea whether each stroke was gentle or violent.
Which is why the rate is so often misread as effort. It is not effort. You can row 30 s/m with almost nothing behind it, and the manufacturer's name for that is spinning your wheels ([4] Concept2 2013). The rate tells you how often the strokes happen; watts tell you how much each one delivers.
What the rate is good for is rhythm and cost. Rowing more slowly gives the flywheel more time to slow down, so each stroke must be stronger to hold the same speed; the manufacturer's own bands put 18 to 22 s/m in the technique bucket, 24 to 28 for steady state and 30 to 36 for racing and intervals ([3] Concept2 2017). Nor is the rate a free dial: with stroke rate manipulated between 20 and 36 per minute, higher rates put more of the rower's power into the boat's average velocity and more into velocity fluctuation ([8] Hofmijster 2007).
Watts
Watts are the most useful number on the machine and the easiest to misuse. Power is how fast you are doing work rather than how much, and that is what makes an erg piece comparable with a bike ride or a loaded sled. The manufacturer makes the same point when it recommends watts as the unit to use if you want to compare the rowing with other exercise ([1] Concept2 2015).
The number is also only as good as the machine's arithmetic. Fifteen rowers rowing on a Concept2 were monitored against an instrumented reference, and the ergometer's mean power per stroke sat 11 to 15 per cent below the reference, with stroke-to-stroke variation heavily smoothed ([10] Holt 2021). The watts are a working estimate, not a laboratory measurement.
And watts are a function of the machine's setting as well as your effort. In laboratory work on ergometers and boats, mechanical power rose with stroke rate, and on the ergometer the drag factor correlated strongly with the power reading ([9] Held 2020). Turn the damper up and the same effort reports more watts, because the machine is resisting you harder. That is the lever changing the reading, not you getting fitter.
Calories
The calorie figure is the least trustworthy number on the screen, and the manufacturer says so in plain words: these readings are an estimate, because exact calorie burn rate varies from person to person ([2] Concept2 2024). The machine cannot weigh you, cannot measure how much of you is moving, and cannot see how much of the work your arms are doing rather than your legs.
That estimate has been tested. On a Concept II ergometer, checked against indirect calorimetry, the machine's own monitor significantly overestimated energy expenditure at low and moderate intensity ([11] Erdogan 2010). The study used forty-three overweight and obese adults, so treat the calorie figure as a consistent unit, not a quantity.
Heart rate
Heart rate is the only reading on the screen that comes from your body rather than the machine, and it is the easiest to over-read.
The monitor does not measure your heart. It displays a heart rate that arrives from a monitor you pair with it, over Bluetooth or ANT+ ([6] Concept2 2019). Which monitor you pair matters, because the number is only as good as the sensor underneath. Wrist-based devices struggle with accuracy during rowing, where the tendons flex while you pull, and the manufacturer's advice is a chest belt if you want better accuracy ([6] Concept2 2019). A chest belt reads the electrical signal from your chest, and in twenty-five healthy adults the chest strap's mean absolute percentage error for heart rate was 0.76 per cent against a three-lead clinical ECG, while a vest on the same sensor was off by 3.32 per cent ([12] Parak 2021).
What heart rate can tell you is how hard your cardiovascular system was working. What it cannot tell you is how much work you did, and it carries more noise from things unrelated to your fitness — sleep, what you ate, stress. The manufacturer's own use for it is as a second opinion on the monitor's repeatable effort data: repeat a piece at the same intensity, and if your fitness is improving, your heart rate for it should come down ([6] Concept2 2019).
The lever and the measurement
The damper is the most misunderstood control on the machine, so it is worth separating two things that share a name.
The damper is the lever you set. It changes how much air reaches the flywheel, and that changes how fast the flywheel spins down between strokes. The drag factor is the reading the machine takes: the monitor measures how quickly the flywheel is decelerating after each stroke, and uses that to work out how much work you did ([5] Concept2 2024). One is an input you choose; the other is an output the machine reports.
The part that matters for training: at a comparable submaximal effort, the physiology does not care where the lever is. Fourteen club rowers — seven men and seven women — did the same incremental test at drag factor 100 and 150, and oxygen uptake, heart rate, blood lactate and rowing economy did not differ significantly across the submaximal stages ([7] Kane 2008). The effort was the same; only the numbers moved.
So changing the damper changes how your effort is expressed, not what your muscles have to give. It changes the stroke, not the fitness.
The trade-offs
Three honest limits on what the screen can do for you.
It cannot tell you how hard the effort felt. The machine knows about a fan and a handle, not about the sixth stroke into a piece when your hands are gone. If a number and your own judgement disagree, your judgement is closer to the truth. Nor can it tell you what the piece will do for you tomorrow, because the monitor measures the piece, and whether a piece makes you fitter is a question about weeks.
It cannot compare you with anybody else except through one number. Distance, calories and heart rate all depend on your body, your machine and the day. The average split is the one reading that travels between machines and between people.
Which number do I actually use?
One sentence, if you only take one.
Track the average split for your piece, and treat everything else as context.
The average split is repeatable and comparable between machines. Stroke rate and watts tell you how hard you went, which matters in the moment and much less in the log. Distance, calories and heart rate are outcomes, and two of the three are estimates.
What to do tomorrow
Open the monitor on your last piece and read it once, out loud: how long, how far, the average split, your rate, your average watts. Then do the same for a piece from a month ago and compare the average splits. If the number went down, the work is in the log and nothing else needs to tell you so.
Then do the thing most people never do: change the damper on a familiar piece and watch what happens to the average watts. If the watts move and the effort felt the same, you have seen the difference between a measurement and a setting.
Every reading on the monitor answers one of three questions: how much, how hard, or how it went. The average split answers the first one best, and it is the one to write down.
Key points
- Split and time answer how much; stroke rate and watts answer how hard.
- Distance, calories and heart rate answer how the piece went.
- A lower 500 m split means more work, not less.
- Stroke rate counts strokes. It does not measure how hard you pull.
- The damper is the lever you set; drag factor is the reading the machine reports.
- For most training, the average split is the one number worth writing down.
Editorial & Coaching Standards
Guides in the MyNextRow Learn library are created by Concept2 athletes and coaches, synthesizing peer-reviewed sports physiology, biomechanics literature, and authoritative rowing guidelines. Every workout protocol and technical cue is tested for safety, repeatability, and PM5 monitor compatibility.
Sources and further reading
- Concept2. 500 m split: what does it mean (blog, 2015)— The on-water convention the monitor borrowed: pace is time per 500 m, the smaller the number the faster you are going, and a 2:00/500m pace is what an eight-minute 2k is built around.
- Concept2. Getting the most out of the PM5 (first archive capture 2024)— The display screens and the three units, and the plain statement that the calorie reading is an estimate because exact burn rate varies from person to person.
- Concept2. Rowing stroke rate explained (blog, 2017)— What the s/m readout counts, and the manufacturer bands: 18-22 for technique, 24-28 for steady state, 30-36 for racing and intervals.
- Concept2. Debunking the myths: damper setting, stroke rate and intensity (blog, 2013)— Separates the three things beginners confuse: intensity comes from how hard you pull, not from the rate or the lever position.
- Concept2. What damper setting and drag factor to use on the RowErg (first archive capture 2024)— The damper is the lever that sets how much air reaches the flywheel; drag factor is the deceleration the monitor measures between strokes.
- Concept2. A perspective on heart rate training (blog, 2019)— Wrist devices struggle with accuracy during rowing because tendons flex, so use a chest belt; and heart rate moves with sleep, eating and stress.
- Kane DA et al. Effects of drag factor on physiological aspects of rowing. Int J Sports Med 2008;29(5):390-394— Fourteen club rowers — seven men and seven women — did the same incremental test at drag factor 100 and 150; oxygen uptake, heart rate, lactate and rowing economy did not differ significantly.
- Hofmijster MJ et al. Effect of stroke rate on the distribution… J Sports Sci 2007;25(4):403-411— Nine participants with stroke rate manipulated between 20 and 36 per minute: at higher rates more power reached boat velocity and more was lost to velocity fluctuation.
- Held S et al. Changes in mechanical power output in rowing by varying stroke rate and gearing. Eur J Sport Sci 2020— Power rose with stroke rate, and drag factor correlated strongly with power on the ergometer, so the setting moves the reading as well as the effort.
- Holt AC et al. Concurrent validity of power from on-water systems and a Concept2 ergometer. Front Physiol 2021— Fifteen rowers against an instrumented reference: the Concept2 mean power per stroke ran 11 to 15 per cent low, and stroke-to-stroke variation was smoothed.
- Erdogan A et al. Accuracy of the Polar S810i heart rate monitor and the Sensewear Pro armband… J Sports Sci Med 2010— On a Concept II ergometer checked against indirect calorimetry, the machine monitor significantly overestimated energy expenditure at low and moderate intensity.
- Parak J et al. Comparison of heart rate monitoring accuracy between chest strap and vest… Sensors (Basel) 2021;21:8411— Against a three-lead clinical ECG, the chest strap mean absolute percentage error for heart rate was 0.76 per cent, against 3.32 per cent for the vest.